
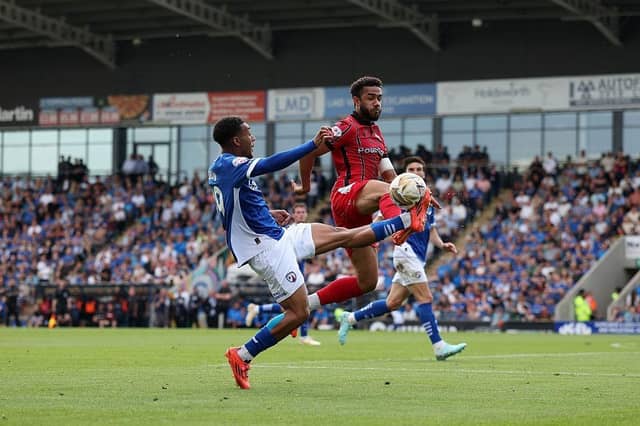


The eye-catching figures – produced by OddsMatrix – uses data from Capology to calcute how much every team spent on player wages during the last campaign.
The stats – if they are to be believed – also provide an interesting insight into which clubs got value for money and which sides badly underachieved.
Here we look at how the League Two table would have looked based on wages.
Join the debate over on our social media channels.
Get the latest Spireites news, here.




1 / 6