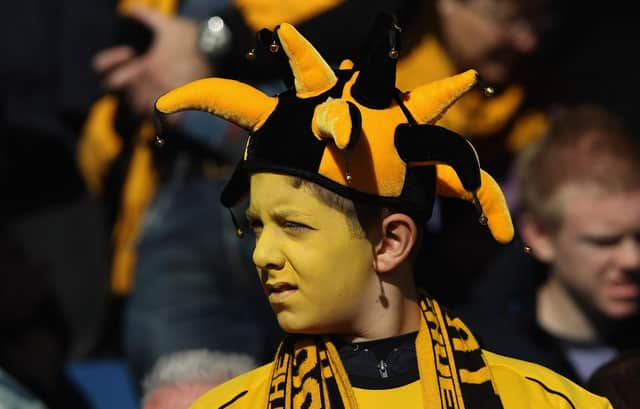
That’s to be expected of course with a host of former Football League clubs such as York City, Hereford, Darlington, Boston United and Chester competing in the division.
Of course crowd sizes don’t guarantee or rule out success, but perhaps it gives an indication as to where that club sits in their division.
Here’s how the alternative league table would look if it was based on each club’s average crowd.
1. York City
York City were watched by 65,428 fans with an average of 3,116. Photo: Getty Images
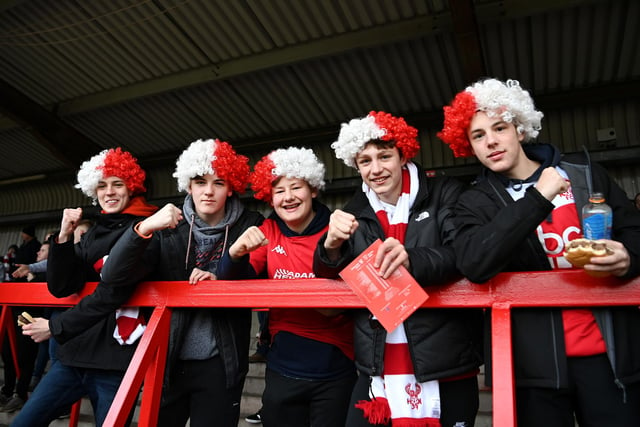
2. Kidderminster Harriers
Kidderminster Harriers had 42,471 fans and a 2,124 average. Photo: Getty Images
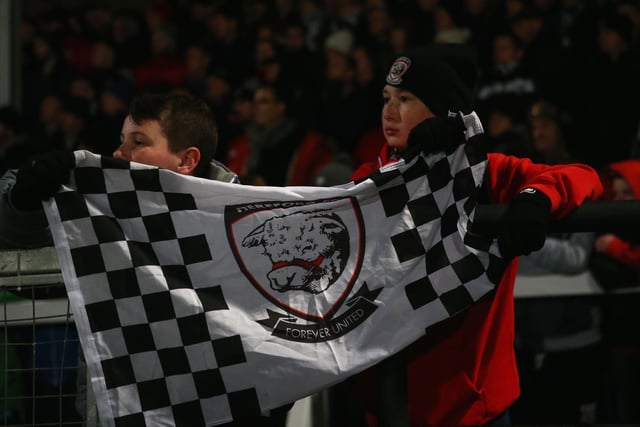
3. Hereford FC
37,822 fans watched Hereford this season with an average of 1,801. Photo: Getty Images
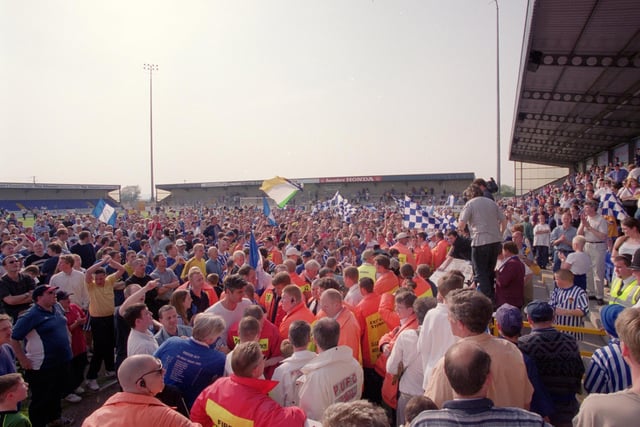
4. Chester City
Chester had a total support of 35,511, with an average of 1,691 fans. Photo: Getty Images
