
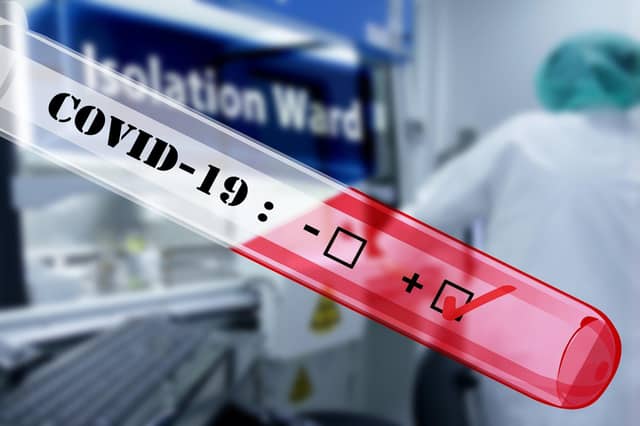

But with the so-called Indian variant fast becoming a cause of concern for the Government with infections identified across the UK, there are fears the roadmap out of lockdown could be threatened.
The latest figures show infections in the latest seven-day period, the first week of May.
Now with gyms, bars and restaurants opened up to customers again, we reveal the situation in every neighbourhood of the town between 30 April and 7 May.
A message from Phil Bramley, Derbyshire Times Editor:
In these confusing and worrying times, local journalism is more vital than ever. Thanks to everyone who helps us ask the questions that matter by taking out a subscription or buying a paper.
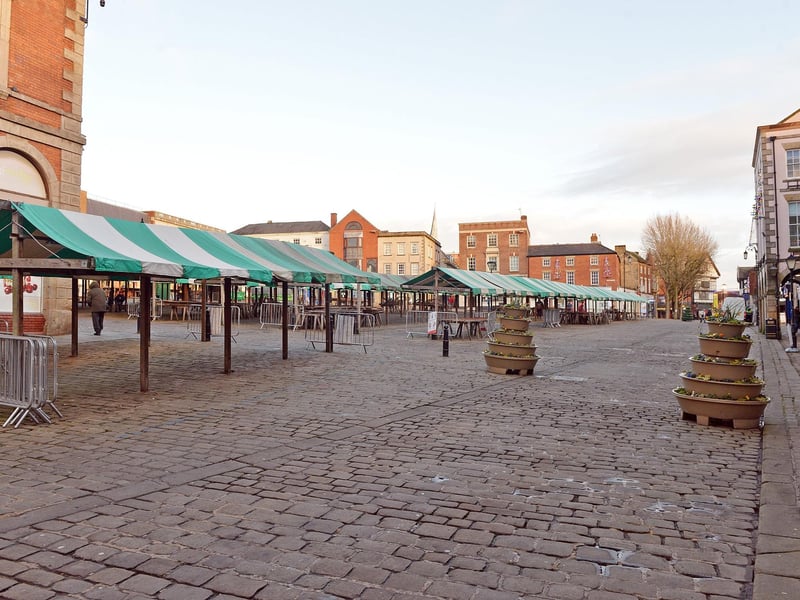
1. Chesterfield Central and Stonegravels
Chesterfield Central and Stonegravels recorded an infection rate of 124.2 per 100,000 during the period of March 6-12, according to figures by Derbyshire County Council in its weekly Covid-19 Surveillance Report. Image for illustrative purposes only. Photo: Brian Eyre
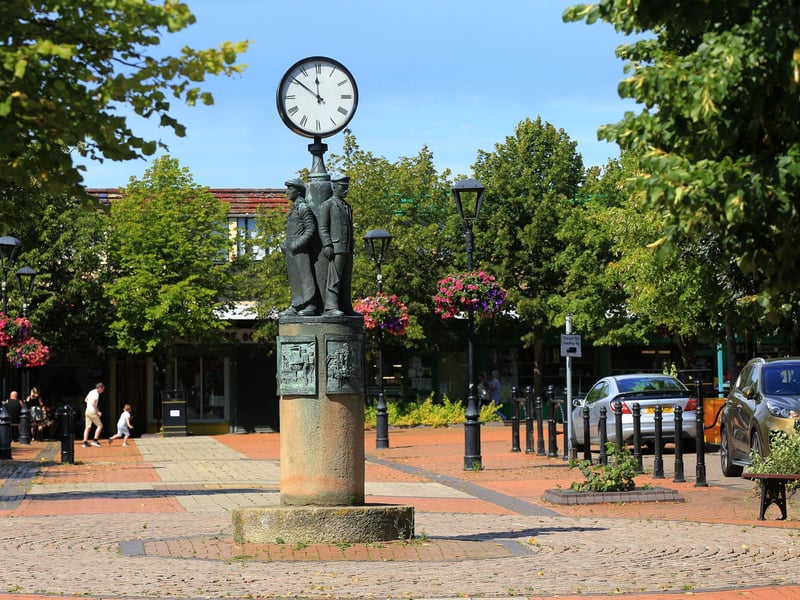
2. Staveley and Norbriggs
Staveley and Norbriggs recorded an infection rate of 113.6 per 100,000 during the period of March 6-12, according to figures by Derbyshire County Council in its weekly Covid-19 Surveillance Report. Image for illustrative purposes only. Photo: Chris Etchells
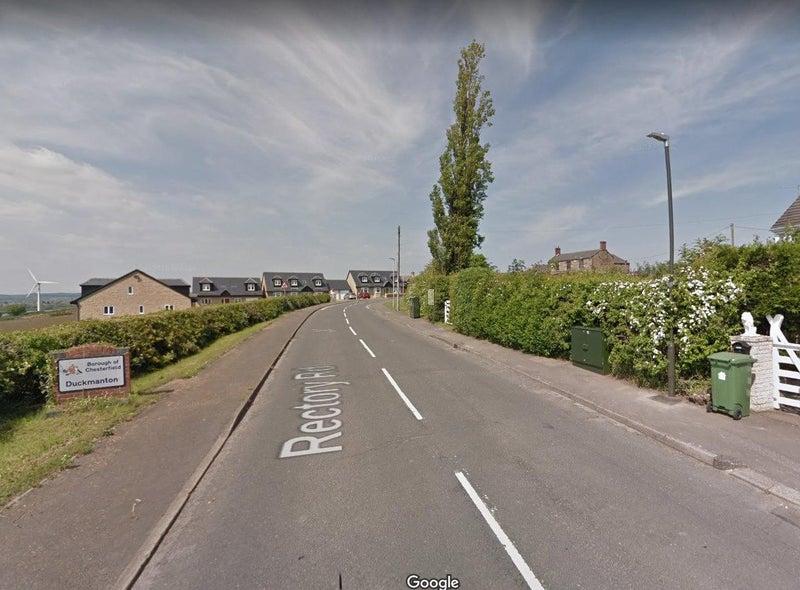
3. Inkersall Green and Duckmanton
Inkersall Green and Duckmanton recorded an infection rate of 78.7 per 100,000 during the period of March 6-12, according to figures by Derbyshire County Council in its weekly Covid-19 Surveillance Report. Image for illustrative purposes only. Photo: Google
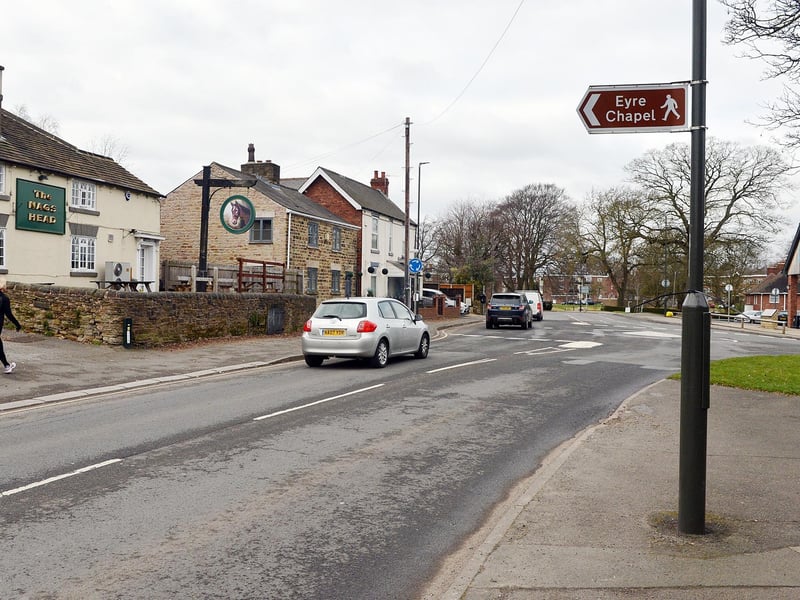
4. Newbold.
Newbold recorded an infection rate of 65.6 per 100,000 during the period of March 6-12, according to figures by Derbyshire County Council in its weekly Covid-19 Surveillance Report. Image for illustrative purposes only. Photo: Brian Eyre