

The data from the Office of National Statistics shows how different neighbourhoods across the area have been affected.
Figures reveal both the number of coronavirus-related deaths between March 2020 and Feburary 2021, and the percentage of all deaths in the neighbourhood during this time which were Covid-related.
A message from Phil Bramley, Derbyshire Times Editor
In these confusing and worrying times, local journalism is more vital than ever. Thanks to everyone who helps us ask the questions that matter by taking out a subscription or buying a paper.
A message from Phil Bramley, Derbyshire Times Editor
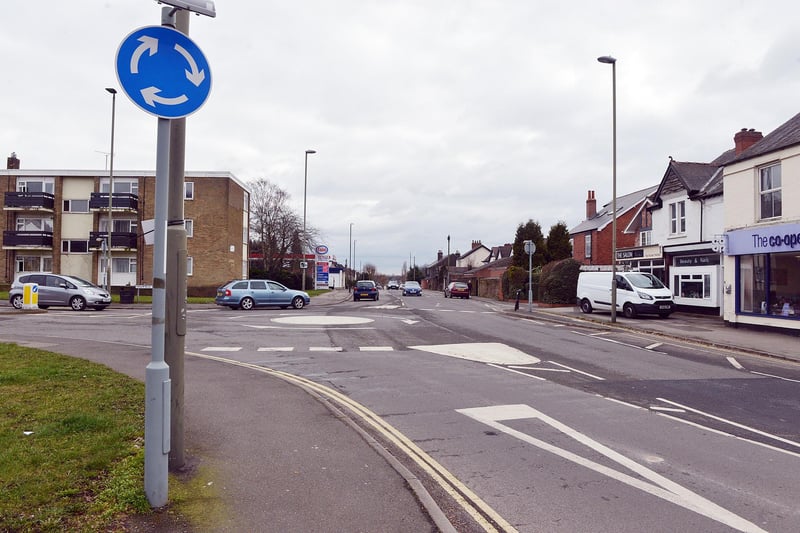
5. Newbold
Newbold recorded 19 deaths from Covid-19 - 17 per cent of all deaths in the area - between March 2020 and February 2021, according to ONS data. Image for illustrative purposes only. Photo: Brian Eyre
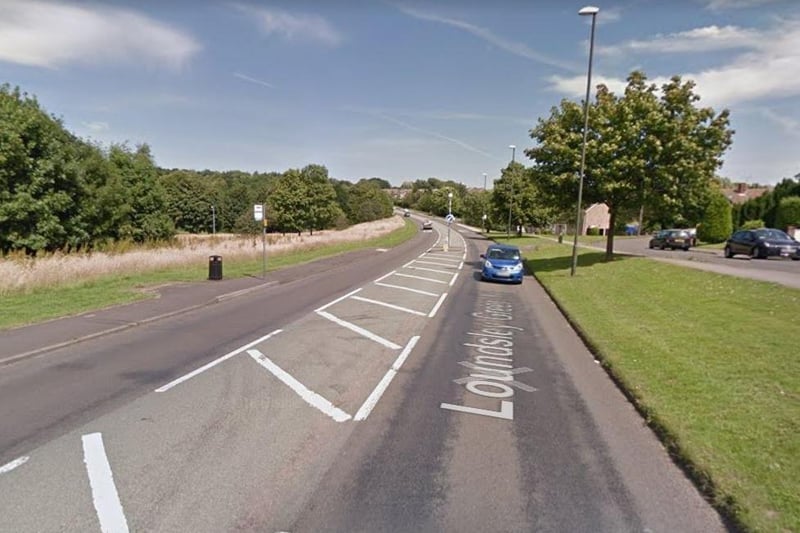
6. Loundsley Green and Holme Hall
Loundsley Green and Holme Hall recorded 13 deaths from Covid-19 - 16 per cent of all deaths in the area - between March 2020 and February 2021, according to ONS data. Image for illustrative purposes only. Photo: Google
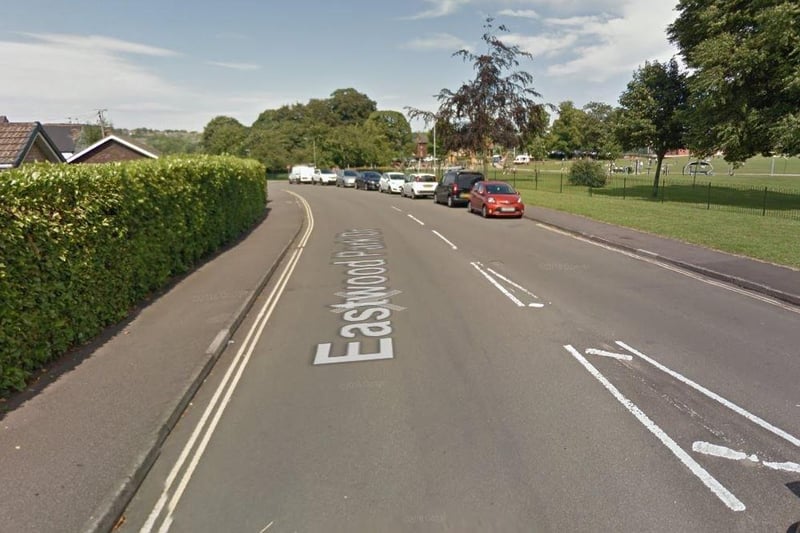
7. Spital and Hasland
Spital and Hasland recorded 24 deaths from Covid-19 - 14 per cent of all deaths in the area - between March 2020 and February 2021, according to ONS data. Image for illustrative purposes only. Photo: Louise Cooper
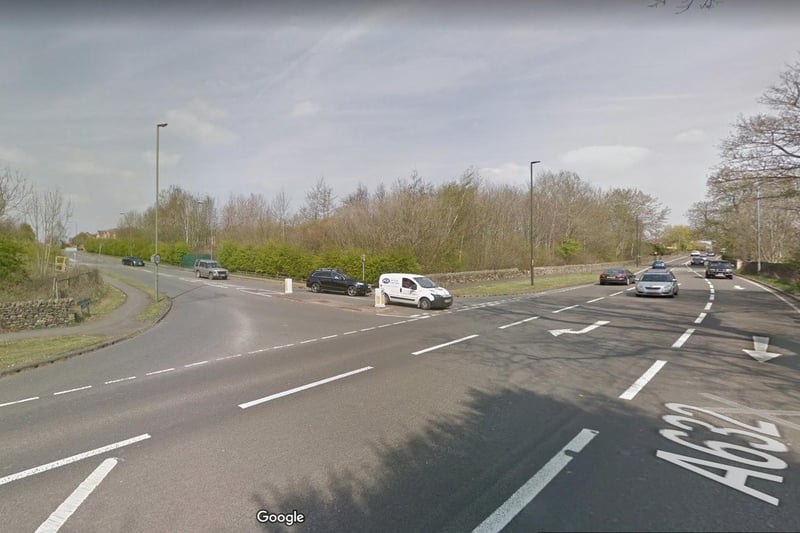
8. Walton and Brookside
Walton and Brookside recorded 14 deaths from Covid-19 - 14 per cent of all deaths in the area - between March 2020 and February 2021, according to ONS data. Image for illustrative purposes only. Photo: Google