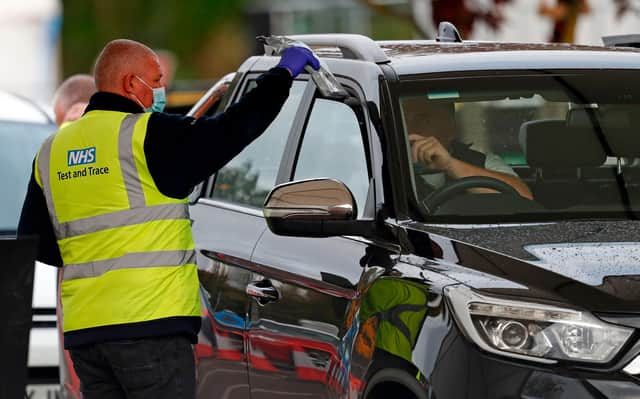
Based on tests in hospitals and in the community in the week to January 28, there were over a dozen areas in Chesterfield which had a rate of fewer than 250 Covid-19 infections in every 100,000 people – making them the most virus suppressed neighbourhoods in the town.
There was one town close to Chesterfield which had an average rate of 94.9 cases per 100,000 people in this most recently recorded period, significantly lower than the country’s average.
Find out where the 13 neighbourhoods with the lowest rates of coronavirus are below.
Images are used for illustrative purposes and are not linked to data in the article.
In these confusing and worrying times, local journalism is more vital than ever. Thanks to everyone who helps us ask the questions that matter by taking out a subscription or buying a paper. We stand together. Nancy Fielder, editor.
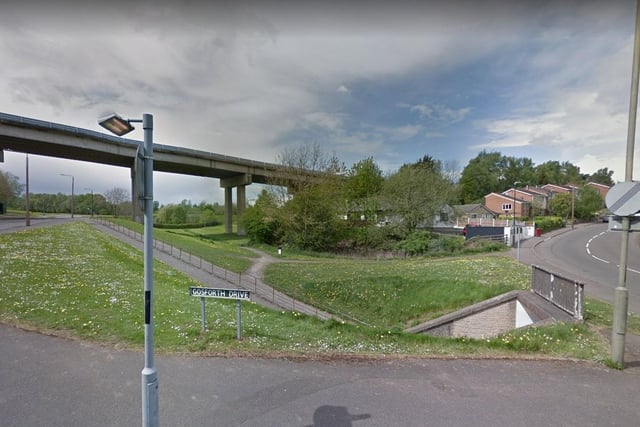
1. Dronfield South and Gosforth Lane
The Dronfield South and Gosforth Lane area had a rolling rate of 94.8 infections per 100,000 in the seven days to January 28. Photo: Google
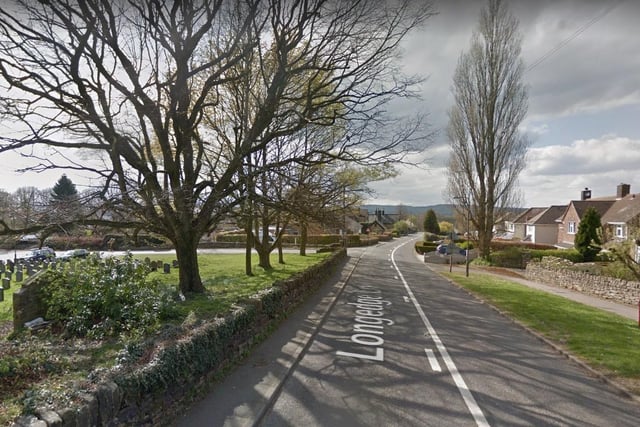
2. Wingerworth and Holymoorside
In the week ending January 28, Wingerworth and Holymoorside had a rate of 108.2 virus cases in every 100,000 people. Photo: Google
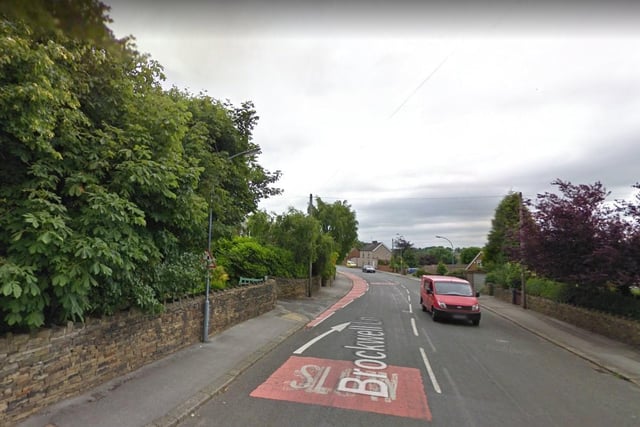
3. Ashgate and Brockwell
Ashgate and Brockwell had a rate of 138.3 infections per 100,000 in the week ending January 28. Photo: Google
4. New Whittington, Hollingwood and Barrow Hill
In the seven days to January 28, New Whittington, Hollingwood and Barrow Hill had a rolling rate of 139.6 Covid-19 infections in every 100,000 people. Photo: Google
