
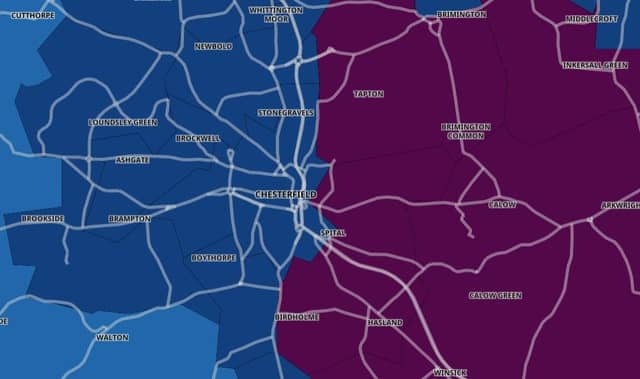

Figures based on tests in hospitals and in the community in the week to January 26, shows there are over a dozen areas in Chesterfield with a rate of more than 300 cases per 100,000 people.
Near the town, one neighbourhood recorded an average rate of 643.7 infections in every 100,000 people in the latest recording period.
The rolling rate estimates how many people on average are likely to be infected by coronavirus based on the number of new infections in the area.
However, the 16 Chesterfield areas with the highest rates of Covid-19 infection are significantly above the average rolling rate across England.
Read the article below to find out where the neighbourhoods are located across Chesterfield.
Images are used for illustrative purposes only and are not linked to data in the article.
In these confusing and worrying times, local journalism is more vital than ever. Thanks to everyone who helps us ask the questions that matter by taking out a subscription or buying a paper. We stand together. Nancy Fielder, editor.
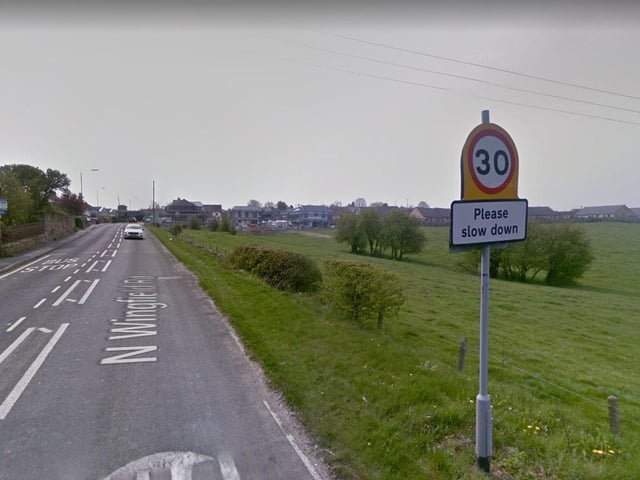
13. Grassmoor and Holmewood
In the week ending January 26, Grassmoor and Holmewood had 331.7 infections per 100,000. Photo: Google
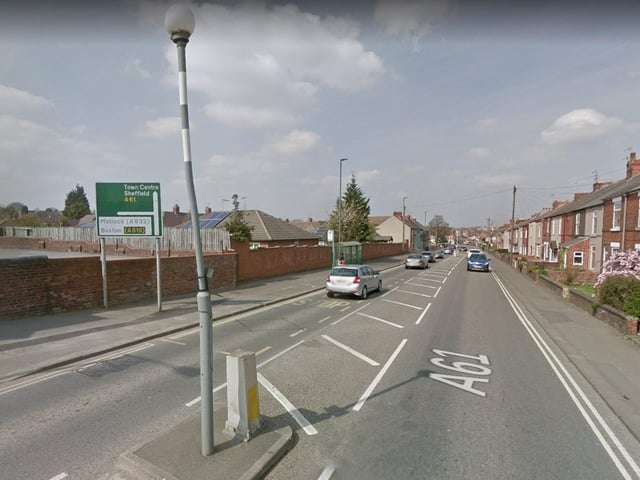
14. Boythorpe and Birdholme
In the seven days to January 26, Boythorpe and Birdholme had 320.6 cases per 100,000. Photo: Google
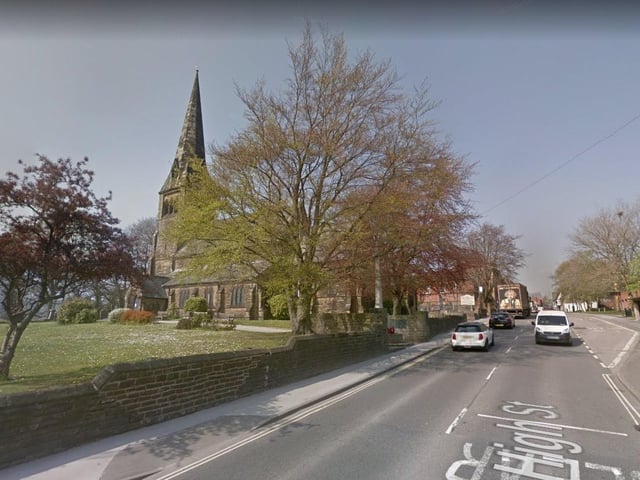
15. Clay Cross
Clay Cross had a rate of 318.1 Covid-19 infections every 100,000 people in the week to January 26. Photo: Google
16. Newbold
In the seven days to January 26, Newbold had 315 cases per 100,000 people. Photo: Google