



The North East has seen case numbers rocket by 73 per cent in a week, with the region now the worst affected part of the UK.
Official figures show it had a rate of 2,609.6 cases per 100,000 residents in the week to January 6, far higher than the peak of 2,043 per 100,000 seen in London in December.
Across the UK, there were 1.2 million positive test results in the week to January 6, a nine per cent rise from the week before.
Case numbers have fallen by 13 per cent in a week in Wales, nine per cent in London and four per cent in the East of England, indicating that the Omicron wave has peaked in these areas.
At neighbourhood level, Covid-19 case rates have been published and here is the situation in every area of Chesterfield up to January 6.
Images used are for illustration only.
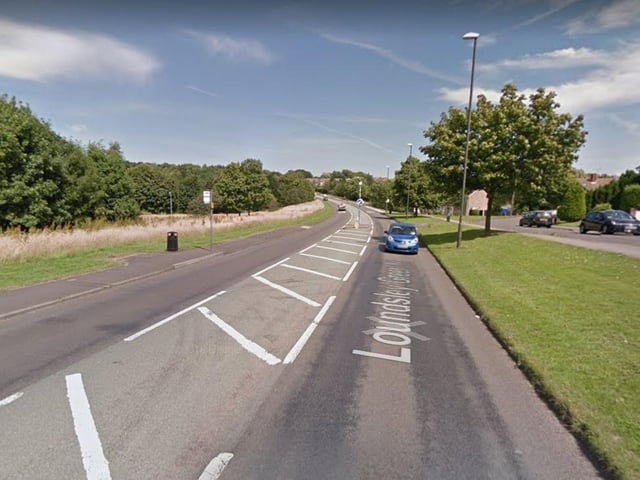
9. Loundsley Green and Holme Hall
Loundsley Green and Holme Hall had 744.7 Covid-19 cases per 100,000 people in the latest week, a fall of 9.4 per cent from the week before. Image for illustration only. Photo: Google
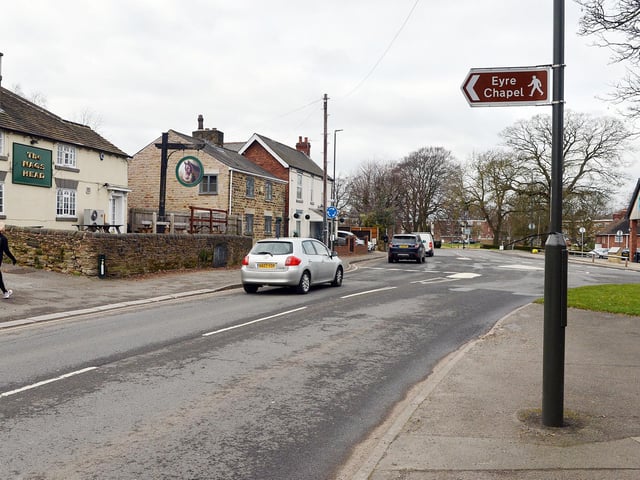
10. Newbold
Newbold had 616.5 Covid-19 cases per 100,000 people in the latest week, a fall of 14.5 per cent from the week before. Image for illustration only. Photo: Brian Eyre
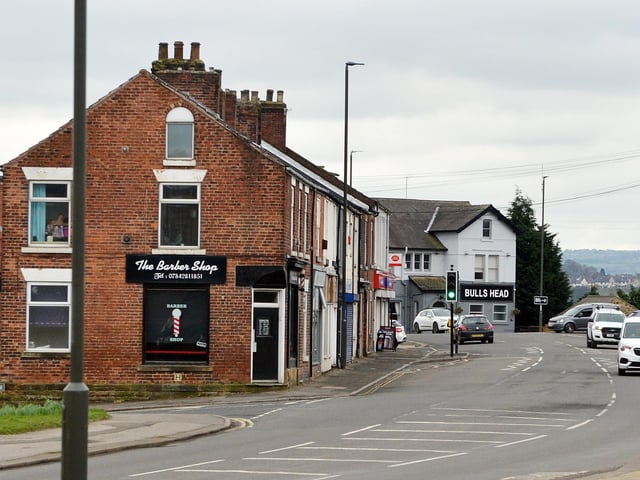
11. Old Whittington
Old Whittington had 825.1 Covid-19 cases per 100,000 people in the latest week, a fall of 22.4 per cent from the week before. Image for illustration only. Photo: Brian Eyre
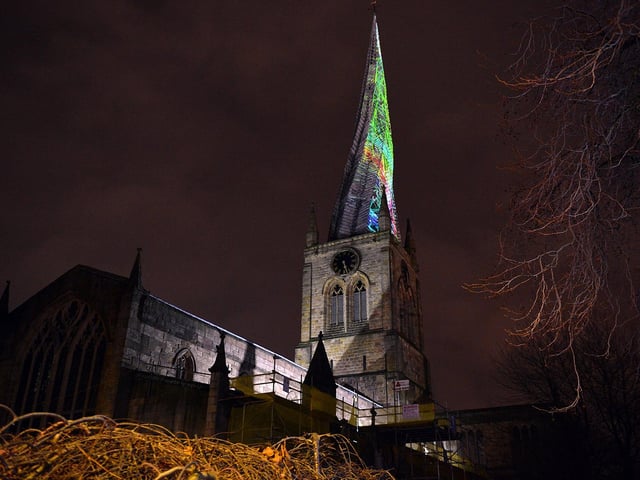
12. Central Chesterfield and Stonegravels
Central Chesterfield had 564.9 Covid-19 cases per 100,000 people in the latest week, a fall of 23.6 per cent from the week before. Image for illustration only. Photo: Brian Eyre