
On Tuesday, January 27, the Government announced the first steps towards new national policies which might breathe fresh life into retail areas which have been hit hard by the rise in internet shopping, hikes in operating costs and pressure on consumer spending, particularly in the wake of the Covid pandemic.
Chancellor of the Exchequer Rachel Reeves said: “If we’re going to restore the pride in our communities, we need our pubs and our high streets to thrive. We’re backing British pubs with additional support, and our new High Streets Strategy will help tackle the long-term challenges that our much-loved retail, leisure and hospitality businesses have faced.
“Thriving local businesses, bustling high streets and pride restored in our communities – that’s what this government is delivering.”
In the wake of the announcement, The Guardian has run a series of special reports on how people’s impression of their local high street is fundamental to their sense of local pride – and growing political anger which could play a big part in the next General Election.
Much of that pride and anger is about feelings, but what do the facts say?
The Guardian also analysed Government and Ordnance Survey data to explore how local high streets all over the country changed between 2019 and 2025.
Though it only offers a snapshot and not the whole story, here is what the data shows bout some of Derbyshire’s biggest population centres.
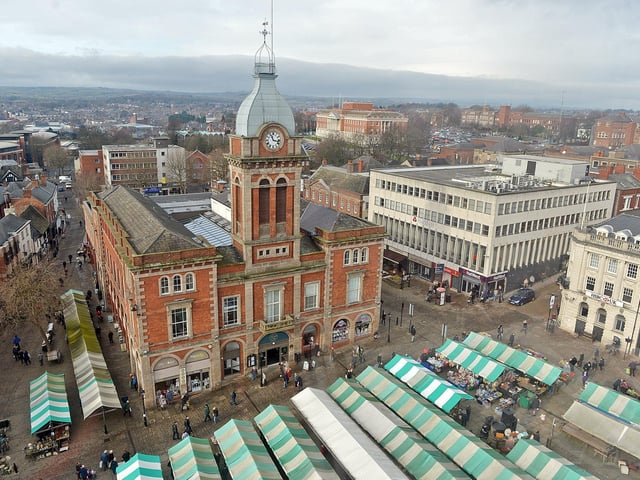
1. Chesterfield
A higher share of empty shops (8%) compared to the national average (5%), but in many categories of high street business more operators were recorded than the national average. Between 2019 and 2025, the proportion of retail businesses fell from 60% to 54%, while accommodation, food and drink operators rose from 40% to 46% of premises. On the up were barbershops and hairdressers (a 17% increase since 2019), pubs and bars (9%), restaurants (26%), and tattoo and piercing studios (33%). On the decline are clothing shops (down 9% on 2019), cafes (down 29%), cash machines (33%), banks (7%), opticians (29%) and bookmakers (55%). Photo: Brian Eyre
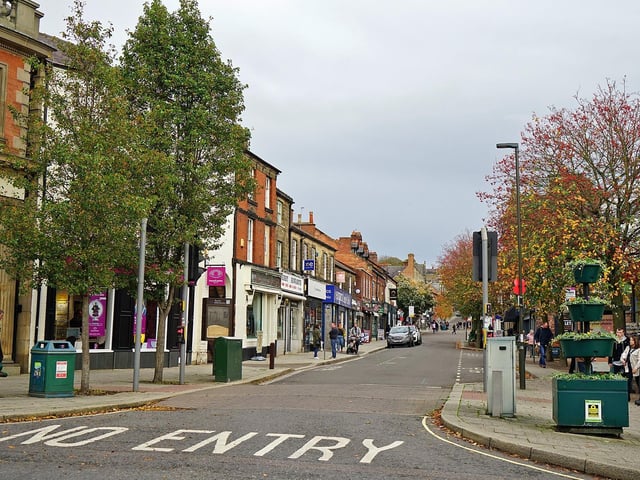
2. Belper
A lower proportion of empty shops (2%) compared to the national average (5%), and in many categories of high street business more operators were recorded. Between 2019 and 2025, the proportion of retail businesses fell from 66% to 60%, while accommodation, food and drink operators rose from 34% to 40% of premises. There was growth in barbershops and hairdressers (up 40%), pubs and bars (52%), restaurants (18%), and opticians (17%). On the decline were clothing shops (down 14% on 2019), cash machines (21%), banks (40%), pharmacies (29%) and florists (2%). Photo: Brian Eyre
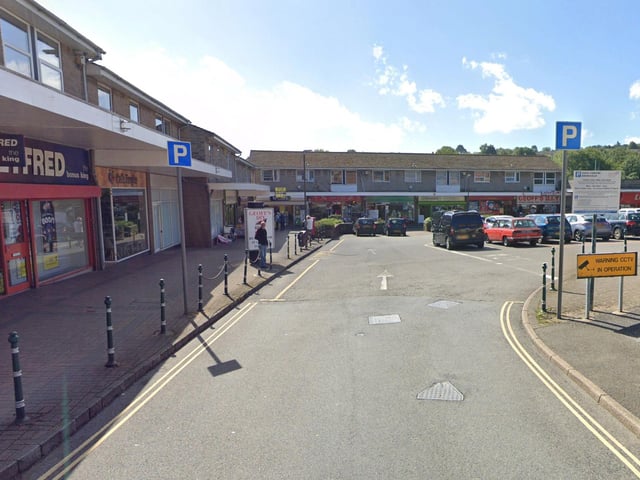
3. Dronfield
A higher proportion of empty shops (12%) compared to the national average (5%), but in several categories of high street business more operators were recorded than the national average. Between 2019 and 2025, the proportion of retail businesses fell from 68% to 64%, while accommodation, food and drink operators rose from 32% to 36% of premises. There was growth in barbershops and hairdressers (up 15%). On the decline were cash machines (down 25% on 2019), cafés (50%), pubs and bars (33%), and opticians (50%). Photo: Google
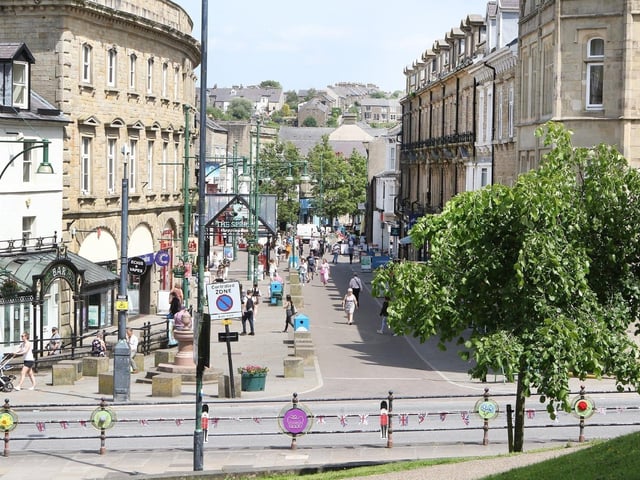
4. Buxton
A lower share of empty shops (3%) compared to the national average (5%), and in several categories of high street business more operators were recorded than the national average. Between 2019 and 2025, the proportion of retail businesses fell from 57% to 54%, while accommodation, food and drink operators rose from 43% to 46% of premises. There was growth in the number of barbershops and hairdressers (up 11%), restaurants (50%), and bookshops (33%). On the decline were cafés (down 10% on 2019), clothing shops (36%), banks (17%) and bookmakers (33%). Photo: Jason Chadwick