


However, despite that, average house prices held up across England – even if there was a drop in sales.
It was the same picture in Chesterfield, where prices rose by 1.8 per cent in the year to September 2020, from £181,792 to £185,056, although the number of sales fell 21.8 per cent, from 1,535 to 1,201.
Across the East Midland, prices rose by 1.8 per cent, from £222,414 to £226,498, while the number of sales fell 25.5 per cent from 76,633 in the year to September 2019 to 57,121 in the following 12 months.
The Office for National Statistics also publishes house price figures by Middle Layer Super Output Areas – small geographic areas containing an average of 7,200 people.
These show eight of the 13 MSOAs that make up Chesterfield Council saw a rise in house prices over the same period – meaning five actually saw prices fall.
Here we reveal which neighbourhoods saw the strongest growth in the year to September 2020, as well as those that did not.
A message from Phil Bramley, Derbyshire Times Editor...
In these confusing and worrying times, local journalism is more vital than ever. Thanks to everyone who helps us ask the questions that matter by taking out a subscription or buying a paper.
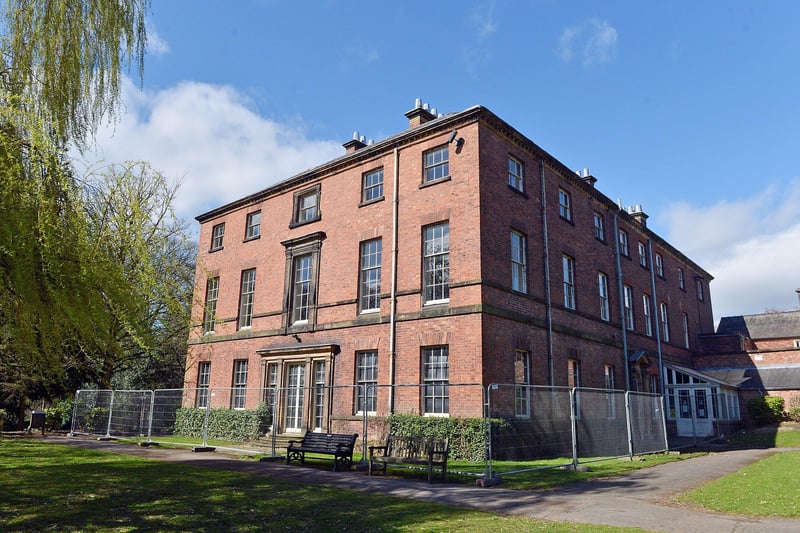
1. Brimington South & Tapton
The joint-biggest price hike was in Brimington South & Tapton, home of Tapton House, where the average price rose to £218,215, up by 14.7 per cent on the year to September 2019. Overall, 90 houses changed hands here between October 2019 and September 2020, a drop of 29 per cent. Photo: Brian Eyre
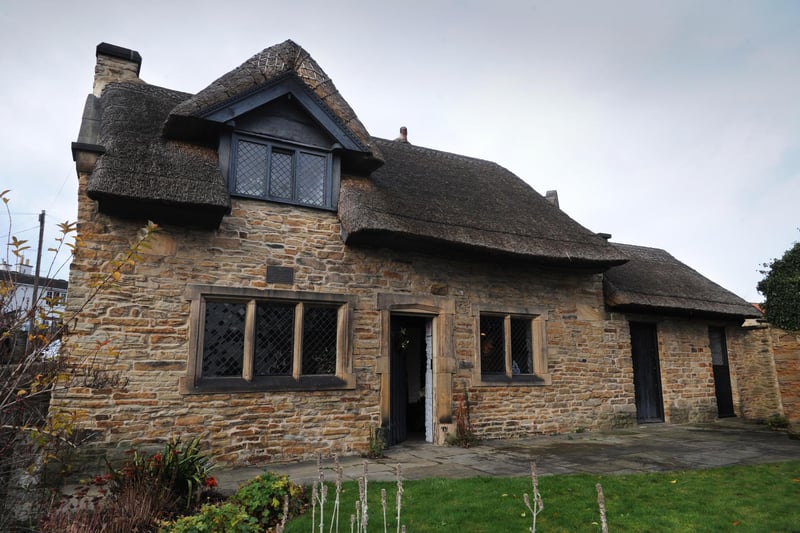
2. Old Whittington
The joint-biggest price hike was in Old Whittington, home of Revolution House, where the average price rose to £176,064, up by 14.7 per cent on the year to September 2019. Overall, 82 houses changed hands here between October 2019 and September 2020, a drop of 16 per cent on the previous 12 months. Photo: Chris Lawton
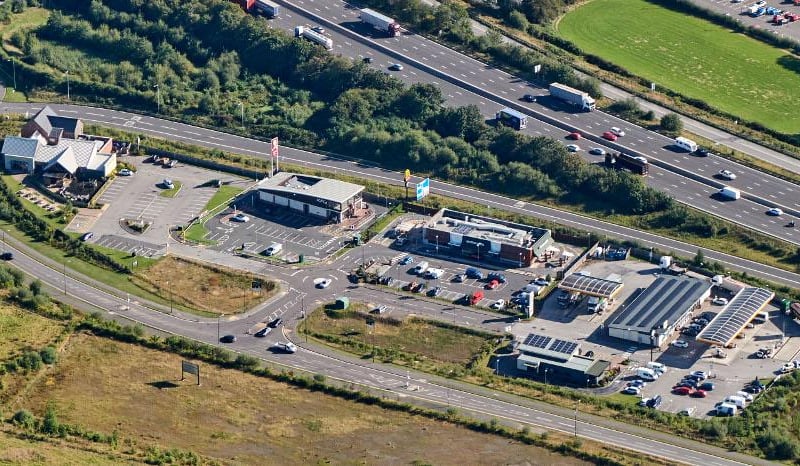
3. Inkersall Green & Duckmanton
The third biggest price hike was in Inkersall Green & Duckmanton, home of Markham Vale Services, where the average price rose to £161,301, up by 11.6 per cent on the year to September 2019. Overall, 79 houses changed hands here between October 2019 and September 2020, a drop of 7 per cent on the previous 12 months. Photo: Submitted
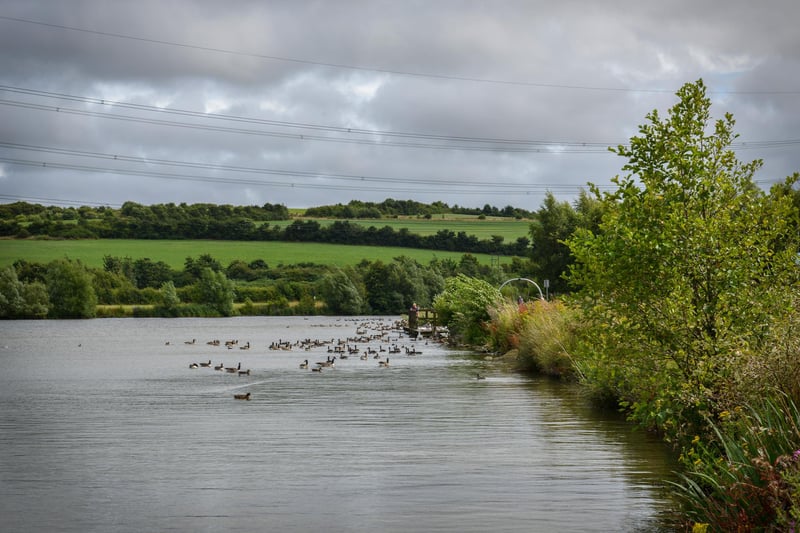
4. Staveley & Norbriggs
The fourth-biggest price hike was in Staveley & Norbriggs, home of PoolsBrook Country Park, where the average price rose to £180,616, up by 8.6 per cent on the year to September 2019. Overall, 79 houses changed hands here between October 2019 and September 2020, a drop of 4 per cent on the previous year. Photo: Rachel Atkins